Threat Analytics Dashboard
The Threat Analytics dashboard displays data about suspicious files or objects.
From the navigation pane on the left, click the Threat Analytics icon:
The Threat Analytics page is displayed:
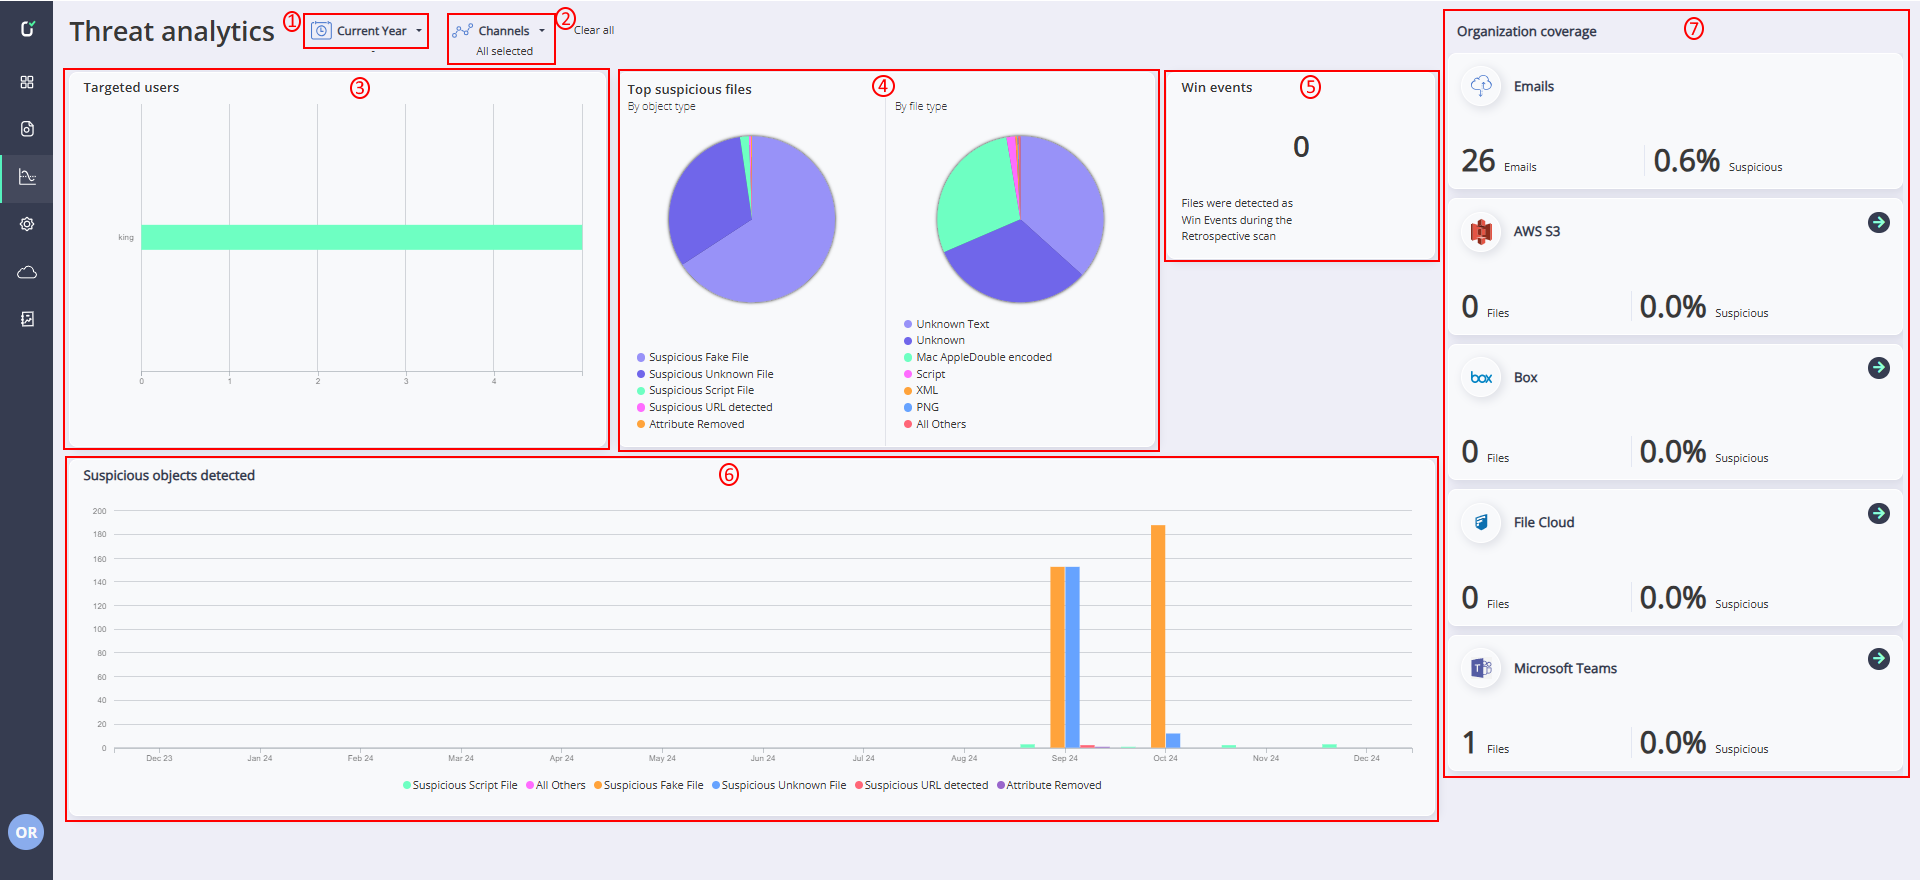
The page contains the following panes, outlined in red and numbered as in the above screenshot:
|
n |
3 Targeted Users - displays the top users targeted with suspicious files. See Targeted users. |
|
n |
4 Top suspicious files - displays pie charts of the top suspicious files. See Top Suspicious Files. |
|
n |
5 Win events - displays the number of Win events detected during the retrospective scan. See Retro Scan. |
|
n |
6 Suspicious objects detected - displays a histogram chart of suspicious objects detected during the selected time period. See Suspicious Objects Detected. |
|
n |
7 Organization Coverage - displays a breakdown of sensitive files per channel. See . |

Comments
0 comments
Please sign in to leave a comment.